Oklahoma City Office Market Sees Solid Activity in Third Quarter
Cordell Brown, CCIM - Office Specialist
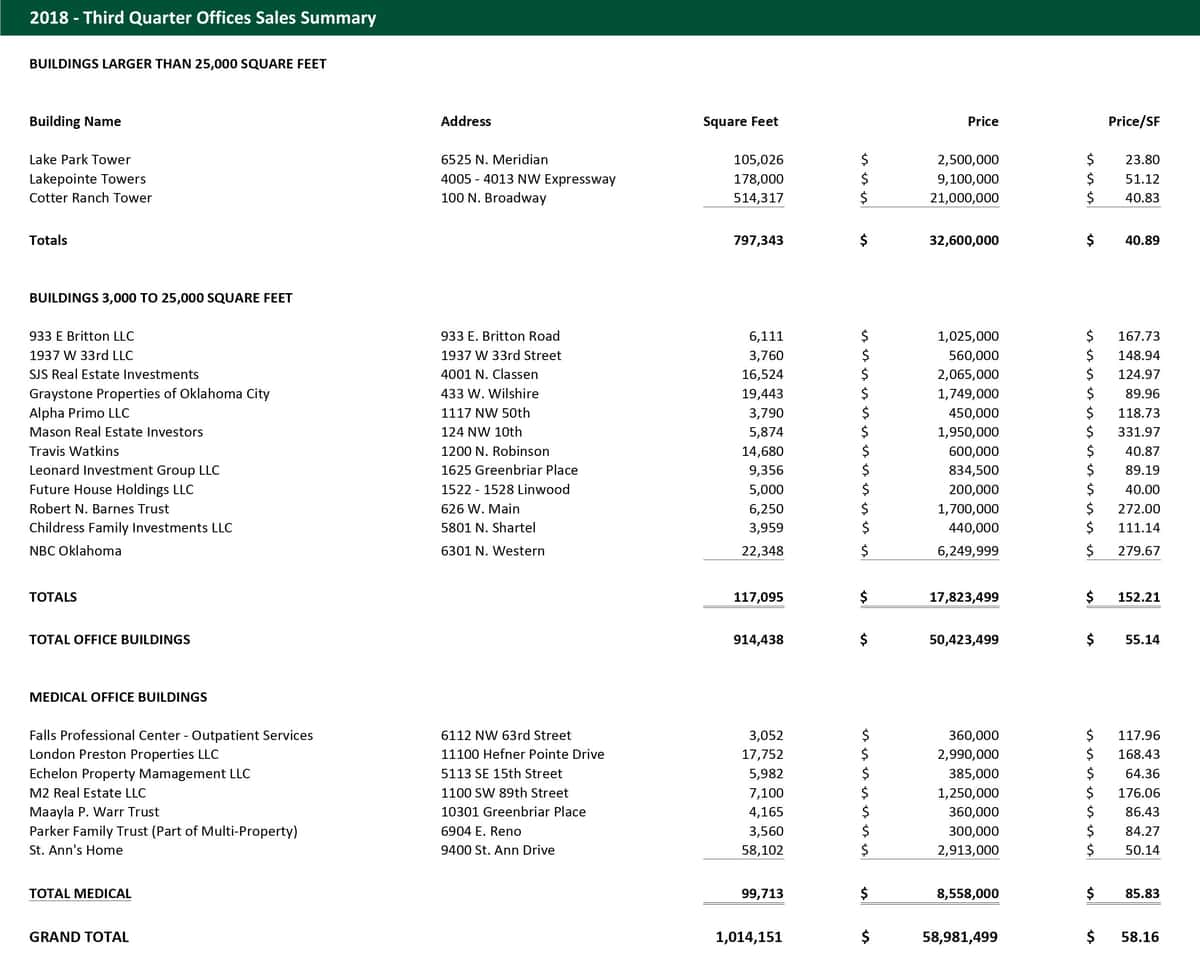
Major properties in excess of 25,000 square feet have changed hands in the quarter but all of the square footage in those sales was the liquidation of three properties owned by the estate of James F. Cotter. Those properties were only in fair condition and will require millions of dollars in upgrades and renovations to compliment the mostly excellent locations they occupy. The 514,317 square foot Cotter Ranch Tower at 100 North Broadway was acquired by BancFirst and will undergo massive renovations, the need for which was reflected in the $21 million ($40.83 psf) purchase price. The building is in a Class A location in the heart of the Central Business District and is in Class C condition.
Lake Pointe Towers is in a Class B suburban location and again, Class C condition. The third property, Lake Park Tower is a 105,000 square foot suburban office building in a Class C location and condition which is reflected in the $23.80 per square foot purchase price. These three sales are the total of the sale of office buildings in excess of 25,000 square feet for the 3rd Quarter. The total square footage was 797,343 square feet at a total price of $32,600,000 or $40.89 per square foot. The good news here is that all the properties were acquired by entities with plans to make the necessary improvements to make the properties worthy of the possibilities they present.
Twelve properties in the 3,000 to 25,000 square foot range changed hands in the quarter. The total square footage was 117,095 at a price of $17,823,499 or $152.21 average per square foot. Sales prices ranged from $40.00 per square foot to $331.97 per square foot.
Seven medical facilities were sold during the 3rd Quarter. They comprised a total of 99,713 square feet, selling for $8,558,000 or $85.83 per square foot. Prices per square foot were not impressive, with a low of $50.14 per square foot for a nursing home to be renovated to $176.06 for a multi-tenant medical clinic.
Total square footage of all office buildings sold in the 3rd quarter was 1,014,151 square feet at a total cost of $58,981,497 or $58.16 per square foot.
Third Quarter Retail Investment Sales - GGP Sells Quail Springs Mall and Sooner Mall
Paul Ravencraft, Phillip Mazaheri, CCIM, George Williams, CCIM - Retail Investment Team
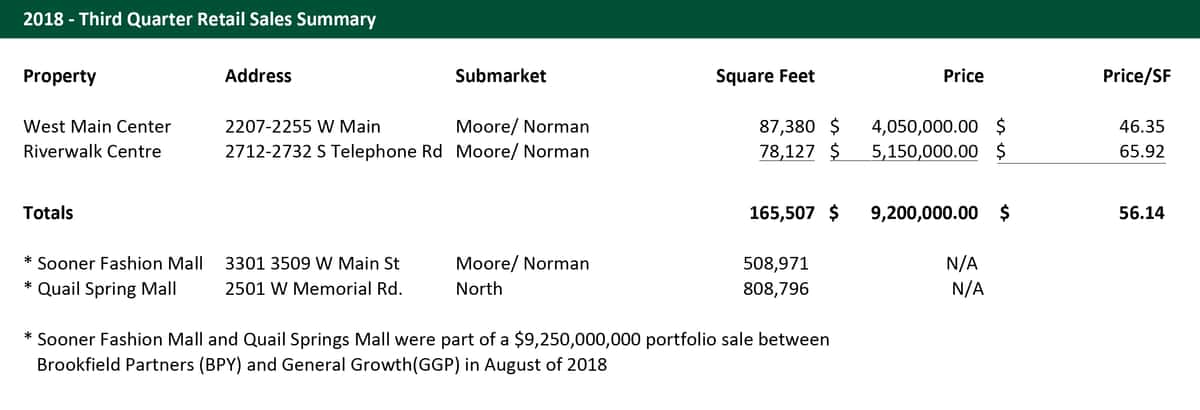
The dominant third quarter transaction was the sale of two of our local malls, Quail Springs Marketplace, and Sooner Mall, to Brookfield Partners by General Growth. This was a large national portfolio sale ($9.25 billion) and not driven by the local malls. The ultimate effect on Quail Springs and Sooner is unknown. As we have discussed previously, both malls have historically performed well but are feeling some of the stress of being second tier malls that are seeing reduced foot traffic, store closures, and difficulty back-filling space with traditional mall tenants. Both these malls are at risk of anchors closing - Quail Springs has already seen Macy's close and JC Penney has struggled. Sooner has a Sears store that is in bankruptcy and another JC Penney. The hope is that Brookfield can be creative in bringing some new and perhaps alternative uses to extend the life-cycle of these two properties.
Aside from this transaction, three centers of over 25,000 square feet changed hands in the third quarter. Berkshire Plaza in Edmond was taken back by the lender through a sheriff's sale; this isn't considered an arm's length transaction. Riverwalk Centre in Moore, which was a foreclosure after the closure of Gordmans, was sold to the ownership entity of Urban Air which plans to open their first Oklahoma City store in the former Gordman's space. The only other sale was West Main Center in Norman.
Rockwell Plaza Shopping Center is reportedly under contract to close in the fourth quarter. A handful of other projects are being marketed for sale as well. Excluding the mall sales, the overall volume of transactions remains historically low as many investors, particularly the local investors that own the majority of our retail product, are generating good returns and would be hard-pressed to replace those returns on a sale. The lack of institutional buyers on recent sales and the run-up in interest rates have increased capitalization rates, further suppressing transactional volume.
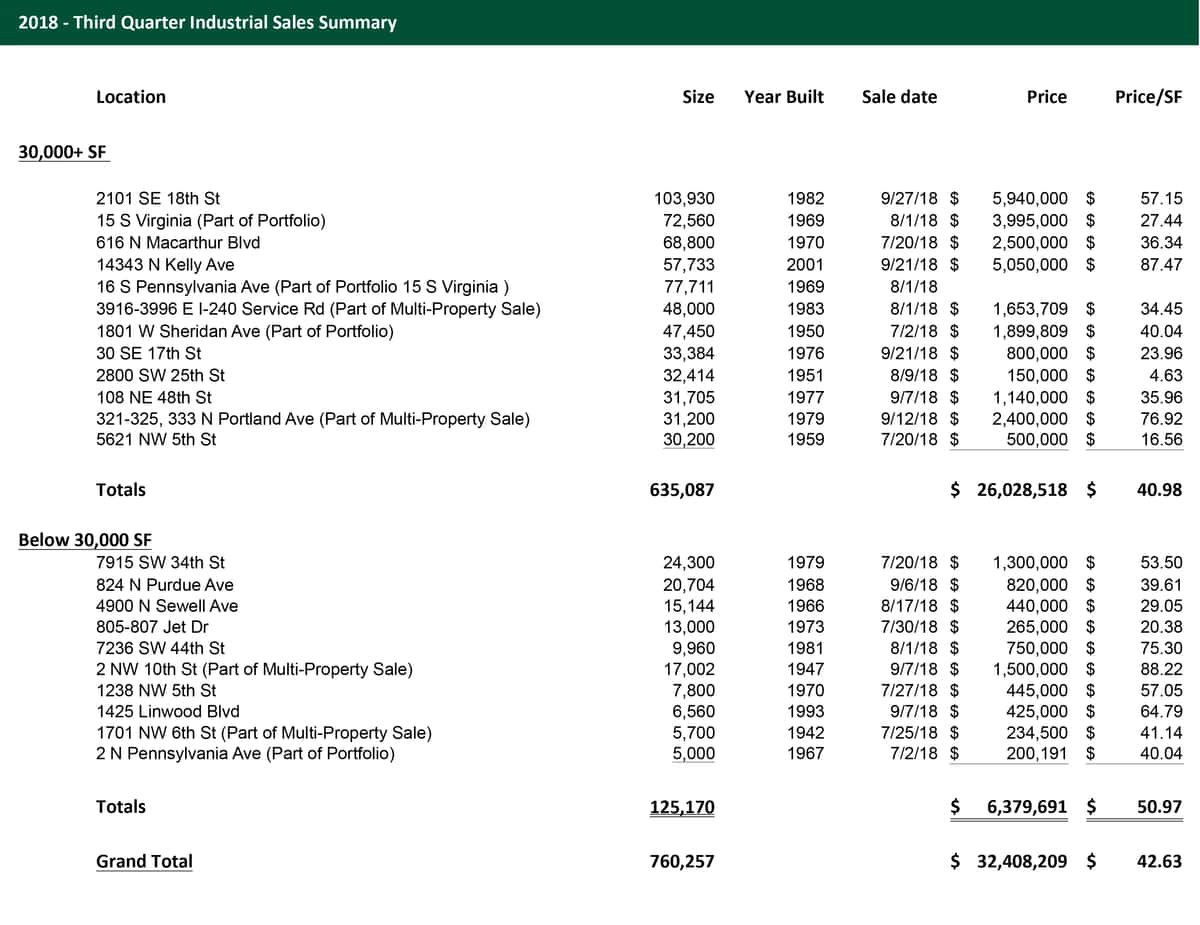
Third Quarter Sees Upward Trajectory in the Industrial Market
Mark Patton, Bob Puckett, Danny Rivera, Chris Roberts - Industrial Specialists
The Third Quarter of 2018 continued an upward trajectory for the industrial market. Overall, there were 22 industrial transactions containing 760,257 square feet. The market-wide average price per square foot in the 3rd quarter was $42.63 with $32,408,209 of total dollar volume.
The industrial vacancy continues to tighten from the previous quarter. It is a reflection of a current steady and stable market dynamic, compared to what can be a highly volatile industrial market depending on our state’s oil and gas production and pricing environment.
The legalization of medical marijuana has already made a dramatic impact on the availability in the Oklahoma City industrial market. However, we have not seen an increase in sales or lease pricing for that particular use, as of yet, but time will tell.
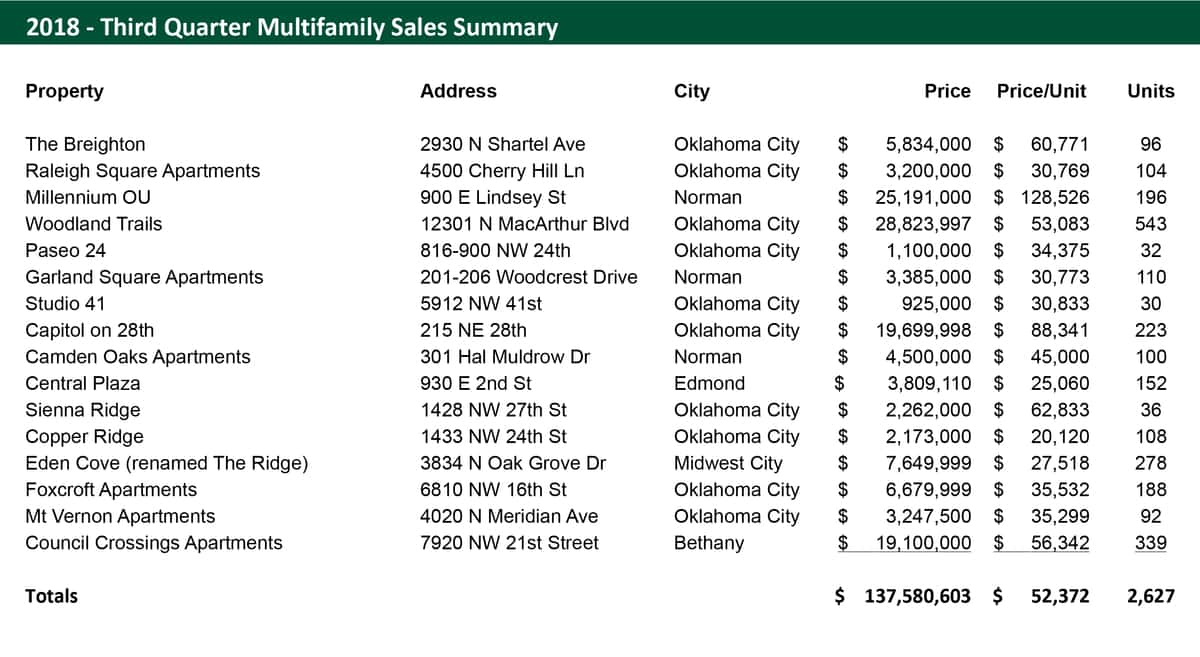
Multifamily Market Experiences Strong Quarter
David Dirkschneider, Michael Massad - Multifamily Investment Specialists
Thanks to the lengthy economic expansion, record-low interest rates, and solid fundamentals, Oklahoma City’s multifamily market has now surpassed any previous year's third quarter year-to-date total unit sales volume. The market is unlike any other before, and the buyer makeup is very different today than in the past. Where only five years ago a syndicator would have been a four-letter word to a seller, now more than half of all buyers are some type of syndication of buyers with many made up of various private capital sources pooled together. The multifamily asset type has become a preferred asset class across various investment portfolios, not only those involved in commercial real estate but everyone from the self-made high net worth individuals to the institutional capital sources. Everyone wants some type of multifamily allocation, and from what it appears, there’s no such thing as too much for now.
In the third quarter of 2018, the Oklahoma City multifamily market saw over 2,600 units transact, for a year-to-date total of just over 7,300. To put that into comparison, there are only three years that Oklahoma City experienced over 7,000 units trade hands, and that was in a full twelve-month period; we still have a full quarter left. Often, the fourth quarter is the most active quarter of the year as buyers are trying to squeeze deals in before the 12/31 deadline. The third quarter had an average price per unit of $52,372 while the year-to-date average is $43,442, 8.44% above the same time last year. The total sales volume for the year is right at an astounding $318 million, and again, we are only at the end of the third quarter.
So far there are no signs of multifamily activity slowing down. Today’s landscape of escalating valuations compressed yields and rising, but still-low interest rates have bred a perfect multifamily investment market. There are fewer reasonably priced investment opportunities in core markets, causing investors to seek opportunities in middle markets like Oklahoma City, driving demand, price, and volume. As long as there is capital available, cap rates and interest rates will adjust, and transactions will take place.
Despite growing competition from other sources, agency lending still dominates the multifamily lending market. Following agency debt is traditional banks, then stepping in where the gap exists bridge lenders are providing multifamily borrowers with a non-traditional option to close transactions where they otherwise may not be able to. This wide variety of lending options is causing an abundance of capital which is continuing to fuel the robust investment activity. This allows borrowers that otherwise may not have been approved to get loans on properties that also may not have qualified from a traditional lender. Maybe it’s a lack of experience on the borrower’s side, lack of liquidity, or net worth. Maybe the property was unstabilized with a low occupancy or the borrower just wanted non-recourse. Whatever the reason, there seems to be a line of debt or equity sources wanting a piece of the multifamily pie. There is a business made of making multifamily conferences where debt and equity investors come together just to be introduced to each other and find deals.
While this type of creative transactional activity is similar to the bus/caravan days of the early 2000’s, the difference between now and then are the fundamentals remain relatively intact. Buyers are very active, but they’re not so greedy that they’re live bidding over each other, yet. As of now, investors are still making decisions based on an asset’s fundamentals. Most agency loans have fairly strict requirements and other than some exceptions, if they don’t fall within certain buckets, they cannot be
funded keeping those programs from being abused as easily. As long as the fundamentals remain in balance, and lending doesn’t get too aggressive, then we are still ahead of the curve compared to 2007’s peak. Historically low, cap rates have increased 35 basis points from the same time last year to a year-to-date average of 6.97%. Further, they appear to be on the rise along with interest rates for the first time in several years as investors begin to expect yield spread with rising rates.
These staggering numbers will only continue to bring the same questions again and again. How long can this last, and when will it end? This run has lasted far longer than most would have expected, but at this point, capital remains available, absorption remains positive causing compression on vacancy rates, and we continue to see positive rent growth. The operational fundamentals remain strong, so even if you purchased during what you previously believed was the peak, you might have more equity than you believe. The question just remains at what point is it the top? While we remain bullish on the multifamily investment market, we remain cautious on the rental market. To keep up with the rising values you need to see unprecedented rent growth, or you need to implement an aggressive management plan to control expenses. Either way, those are not organic ways to grow, and if you don’t hit your projections, you are dependent on the market, but for now, invest only in positive cash flow, and regardless of the market you should be fine.