Office
Cordell Brown, CCIM, CIPS
Office Investment Specialist
Prices Per Square Foot Rise in Second Quarter
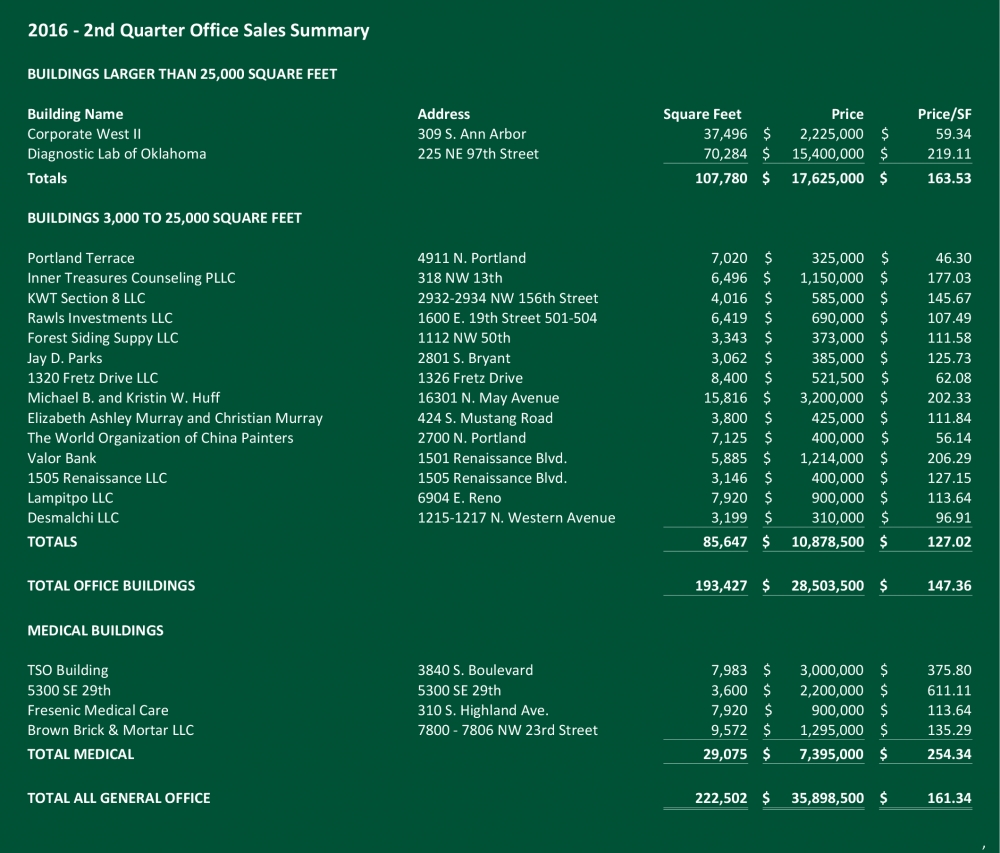
For office buildings in excess of 25,000 square feet, per square foot sales prices rose to $163.53 in the 2nd Quarter, up from $111.39 in the 1st Quarter. The difference is largely attributable to the sale of a building containing 70,284 square feet for the price of $219.11 per square foot. It is leased to a single tenant under a long term lease.
For buildings of 3,000 to 25,000 square feet, the number of sales dropped from 22 buildings in the 1st Quarter to 14 buildings in the 2nd Quarter. The total square footage dropped from 177,010 square feet to 85,647 square feet, and total sales volume dropped from $23,616,500 to $10,878,500.
The sale of Medical office buildings followed the sale of other office properties with slightly over 50% drops in overall square footage and total sales price. That said, the average price per square foot of medical buildings remained fairly consistent with the 1st Quarter averaging $262.67 per square foot compared to $254.34 per square foot for the 2nd Quarter.
Caution is the watchword given the condition of energy markets. However, the industry does appear to have the worst behind it with those companies having too much debt on their balance sheets either in the bankruptcy process or being sold to other better capitalized firms. Office building investors must conduct prudent underwriting of income streams as well as a careful analysis of operating and capital expenditures to be assured of achieving targeted investment returns.

Retail

Paul Ravencraft, Phillip Mazaheri, CCIM, George Williams
Retail Investment Specialists
2016 Retail Property Sales Slow
Only one property of over 25,000 square feet was sold in the first half of the year, Holiday Square Shopping Center, a distressed 86,200 square foot property in the Mid-Del submarket. This after the sale of 42 properties of over 25,000 square feet in the last two years. We see this as a pause as capital remains available and qualified buyers are active in the market. Some of the pause can be attributed to uncertainty related to the the energy industry which still plays on outsized role in the local economy. Nonetheless, many signs of strength remain in the broader economy which is evident by the number of national and regional investors in the market. Currently we have more buyers than sellers as many current investors want to hold on to their returns and don't see good alternatives to invest sale proceeds. This pause does not mean that there isn't activity in the market. A number of smaller properties have changed hands in the first half of the year and several larger properties are on the market. Hunt Properties sold its newly developed 125,000 square foot Shawnee Marketplace in the second quarter at a 6.9 percent capitalization rate; the center is in Shawnee which is just outside our survey area. Quail Springs Marketplace is being marketed for sale as well.
If the improvement in the energy market continues, expect the pace of sales to pick up over the next year to 18 months. Retail in general remains healthy. A sign of the lingering strength of the retail market is current new construction, including larger developments like Chisholm Creek and Shops at Quail Springs, but also numerous 10-20,000 square foot strip centers. Leasing activity for these projects is good and overall market occupancy, particularly in newer centers, remains high.

Industrial

Danny Rivera, Mark Patton, Bob Puckett, Chris Roberts
Industrial Investment Specialists
Q2 2016 Sees Consistent Industrial Market
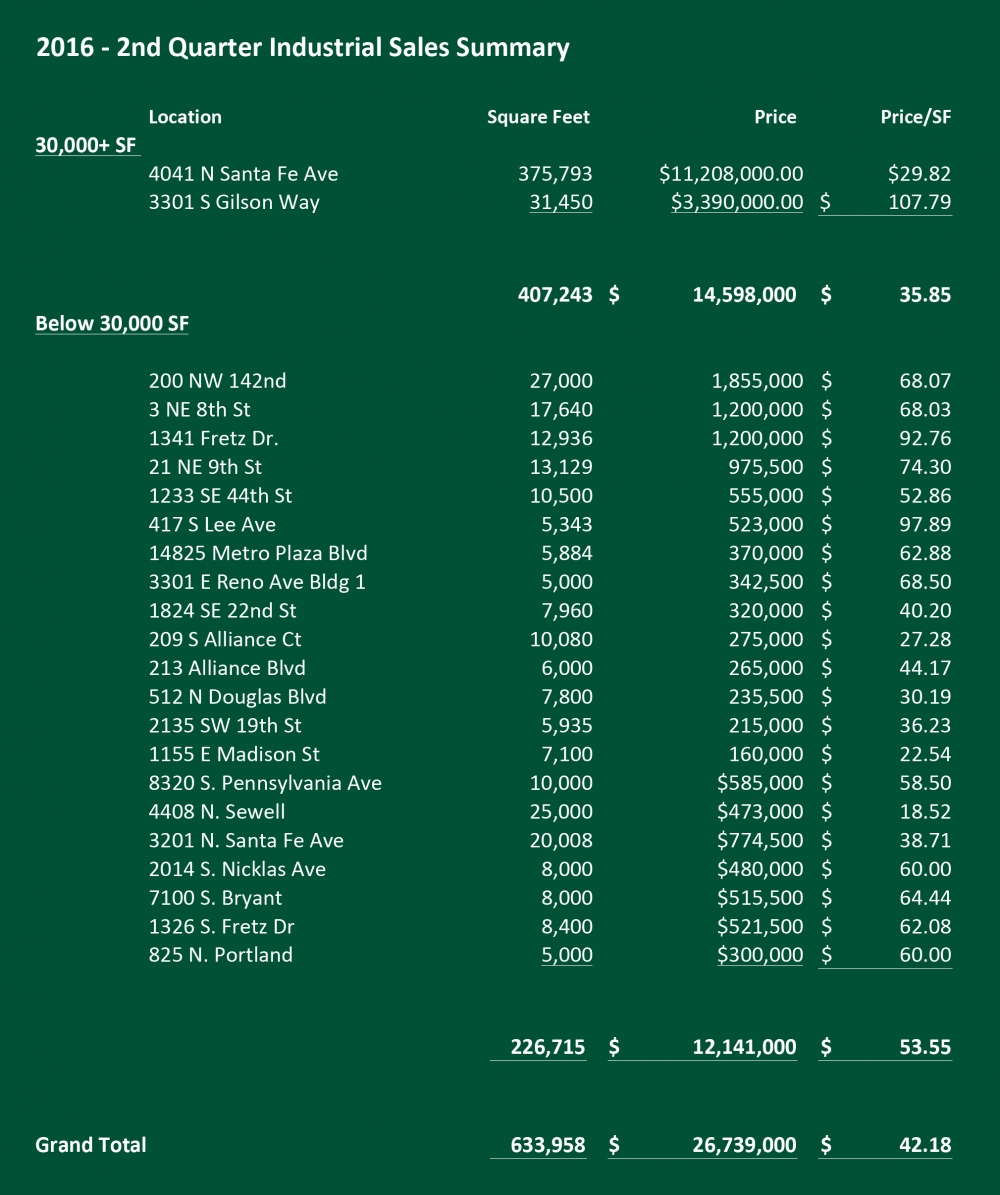
The 2nd quarter of 2016 has remained consistent compared to its predecessor. Overall there were 23 industrial buildings sold containing 633,958 square feet for a total consideration of $26,739,000. The market-wide average price per square foot in the 2nd quarter was $42.18, which is an 8% decrease from the 1st quarter of 2016. The number of transactions remained on par from last quarter; the big influx of dollar volume and decreased price per square foot was due to one large transaction of 375,793 SF for $11,208,000. If this outlier was removed, this quarter would almost be a mirror image from the 1st of 2016.
All things considered, the Oklahoma City industrial real estate market is weathering the storm. A major contributing factor is the decreasing vacancy rate which has been consistently declining from 7% (4th QTR 2015) to 6.2% through present quarter. However, if vacancy rates continue to decrease and the price per barrel of oil and natural gas continues to slowly recover this could cause a problem of demand but not supply.

Multifamily
David Dirkschneider
Multifamily Investment Specialist
Multifamily Market Experiences Slowdown
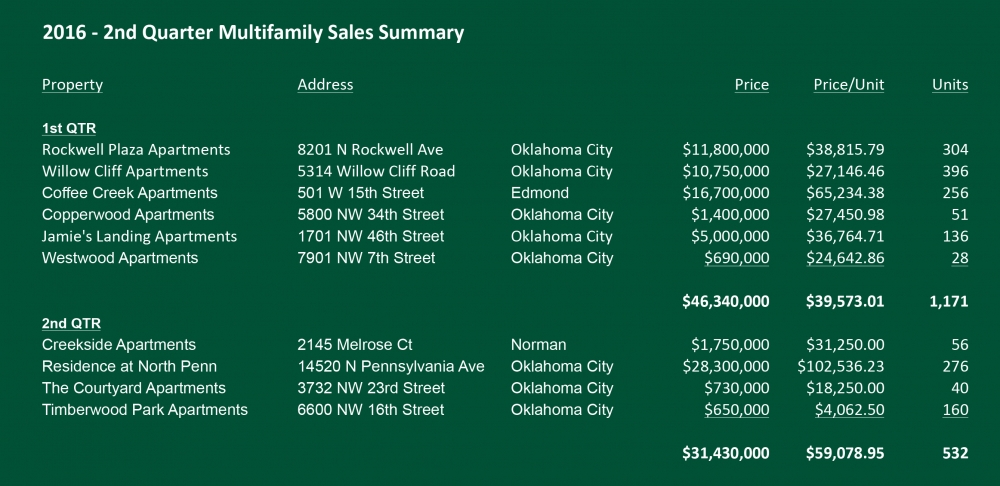
In the second quarter of 2016, the Oklahoma City multifamily market experienced a slowdown as compared to 2015. There have only been 14 transactions in the first half of the year totaling 2,174 units for a sales volume of just over $96 million. This is an average price of $44,213 per unit, 8.97% above the average price per unit for the same time last year, but a decline of 36% in total units transacting. The second quarter of 2016 consisted of half the year’s total transactions with seven properties trading hands accounting for $40 million in total volume and making up 763 of the total units for the year. The total volume is down 56% compared to the same quarter in 2015 and down 29% from the previous quarter. This is an indicator that although the market volume is slowing down, there is still demand for well positioned assets.
Breaking the transactions down by class, there was no activity with Class A assets mid-year 2015, while we have had one transaction, The Residence at North Penn, trading for $28,300,000. The property was built in 2009 and consisted of 276 units giving an average price per unit of $102,536. This is the second time this property has been sold since it was built, and at a $25,000 per unit premium in just four years, again proving the demand for newer, well located properties. Class B properties also only had one transaction year to date, which is half of the same time last year. This is a 2016 total sales volume of $16.7 million which breaks down into an average price per unit of $65,234, 15% higher than 2015. Class C assets are often the largest indicator on our multifamily market as the majority of our market consists of this asset class. Half way through 2016, Class C transaction volume is down 26% to $51,547,250; but what’s more staggering is the decline of 49% in total units sold at 1,514 compared to the 2,954 the previous year. The average price per unit is $34,047 which is only down 12% from the same time last year. One interesting point is there were no non-performing assets sold in the first half of the year other than the one Class D transaction, a vacant 160-unit property for $650,000.
From an operations standpoint, properties have reported rents remaining relatively flat for the year, with numerous properties reporting a decline in occupancy. This is likely attributed to residents moving into for sale housing, but even more attributed to the new inventory supply and lack of job growth. To offset this issue, properties have started to offer more concessions in attempt to maintain their stated rental rates the same. Although concessions ultimately drive an investors net income down, they keep the perception of rental rates as being healthy. So far, there are not any concessions that seem to be of major concern, but one should keep an eye on the rental rates and any unusual concessions going forward. Apartments traditionally experience some additional units turning during the spring and early summer as this is when residents tend to move. We will keep a close eye on the occupancy towards the end of the year, and investors should not expect rent growth to be as high as it was in 2015.
Although the buyers that are active are paying premium prices, the fact remains that there are more buyers staying on the sidelines to avoid bidding wars. The well positioned and properly priced assets have the benefit of multiple buyers, while other properties that are overpriced, or underperforming relative to their asking price remain idle. Despite still relatively low oil prices (but recovering), low interest rates continue to help support the market.


