Office Division
Office Market Experiences Third Quarter Slowdown
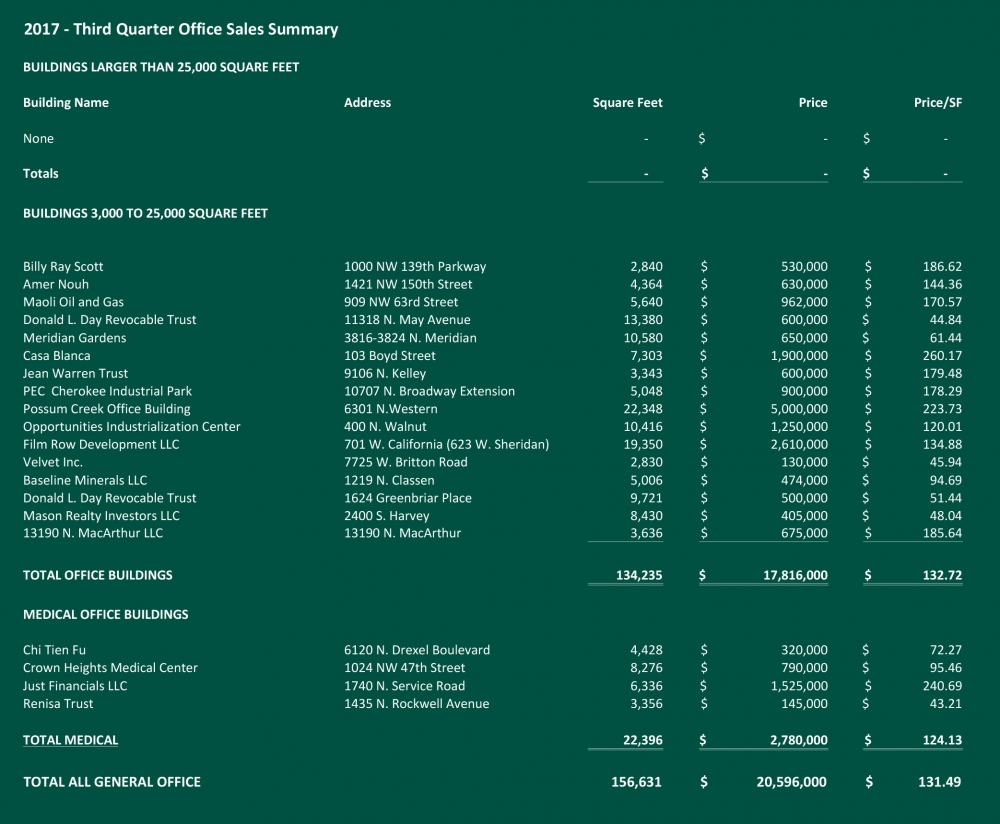
The 3rd Quarter Office Sales could be reflecting the slowdown in sales that have been anticipated by some market watchers. The quarter saw zero sales of buildings in excess of 25,000 square feet and 20 sales of buildings in the 3,000 to 25,000 square feet including four medical office buildings. This marks a significant retreat from the activity seen in the first two quarters of 2017.
The buildings that did sell totaled 156,631 square feet with a total sales volume of $20,780,000 or $131.49 per square foot on average. Buildings sold for a low of $44.84 per square foot to a high of $260.17 per square foot.
We could see more buildings in the larger category come to market in the fourth quarter thus giving us an opportunity to rebound from the third quarter slowdown. The fourth quarter of this year and first quarter of 2018 should be an indicator of whether we are seeing the beginning of a trend or have just experienced an anomaly of low sales for a quarter in an otherwise good year for office sales.
Cordell Brown, CCIM, CIPS
Office Investment Specialist
Retail Division
Village Oaks Plaza, Only Sale
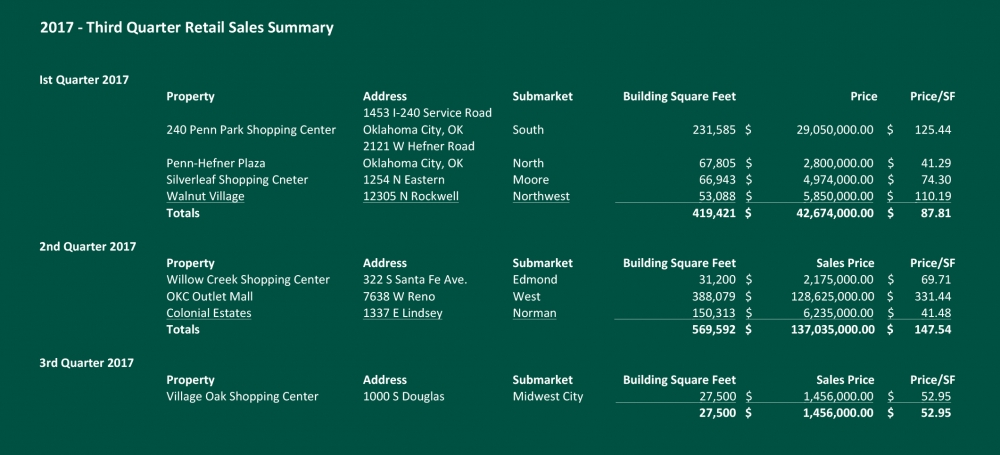
Retail investment sales remained sluggish through the 3rd quarter. Only one property of over 25,000 square feet sold since our last report, the 26,832 square foot Village Oaks Plaza in Midwest City. This 80's vintage property traded for $54 per square foot.
Although the number of closed deals so far this year has been off historical levels, the number of properties being marketed for sale has picked up, particularly class A centers. Quail Springs Marketplace, 240 Penn Park, The Market At Czech Hall, and Bryant Square have all either been marketed for sale or are being marketed. We attribute this to both the added level of uncertainty in the retail market nationally and national investors pulling back from secondary markets like Oklahoma City and a few of these properties being at the end of the investment cycle of its owner. As previously noted, these factors and general market conditions have resulted in a 100 to 150 basis point increase in capitalization rates, creating opportunities for a wider range of investors to bid on these properties.
So far, Oklahoma City has not seen the level of big box vacancy as national markets, but there is some nervousness locally. Neighborhood centers and service product are expected to remain the most stable. That is one of the reasons we've seen less of this type of product available.
Our expectation is that the evolution and change that currently characterizes the retail market will continue at least another two years, thereby making the retail investment market somewhat less stable but at the same time creating investment opportunities.
Paul Ravencraft, George Williams, Phillip Mazaheri, CCIM
Retail Investment Specialists
Industrial Division
Industrial Market Slows in Third Quarter
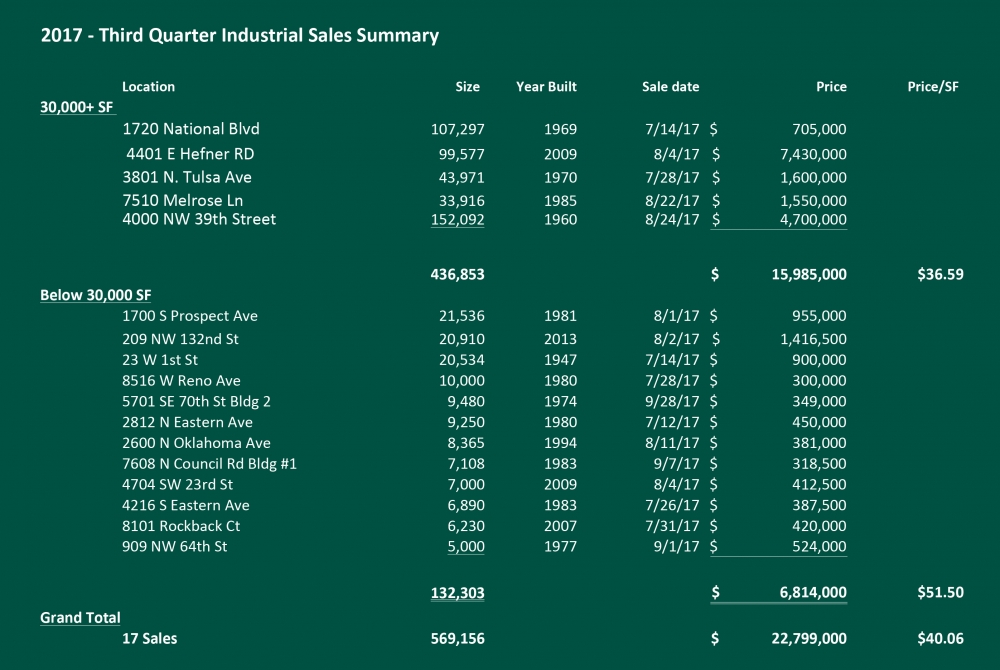
The third quarter of 2017 has slowed for the industrial market as compared with the 2nd quarter of 2017. Overall there were 17 industrial transactions containing 569,156 square feet. The market-wide average price per square foot in the 3rd quarter was $40.06. With the amount of transactions decreasing slightly from the 2nd quarter of 2017, the overall dollar volume also decreased to $22,799,000 versus $50,702,500.
The current economy seems to be holding steady with still some slight hesitation. The decrease in dollar volume illustrates the hesitation. Even though industrial vacancy has leveled at 7.5% from the previous quarter, it still represents a very high occupancy market dynamic. In a market the size of Oklahoma City, a low vacancy rate translates to a competitive market for all parties involved. Another contributing factor is the lack of speculative development which impacts an already tight market. However, if speculative development is implemented it could create a great opportunity for both the Landlord and Tenant.
Danny Rivera, Mark Patton, Bob Puckett, Chris Roberts
Industrial Investment Specialists
Multifamily Division
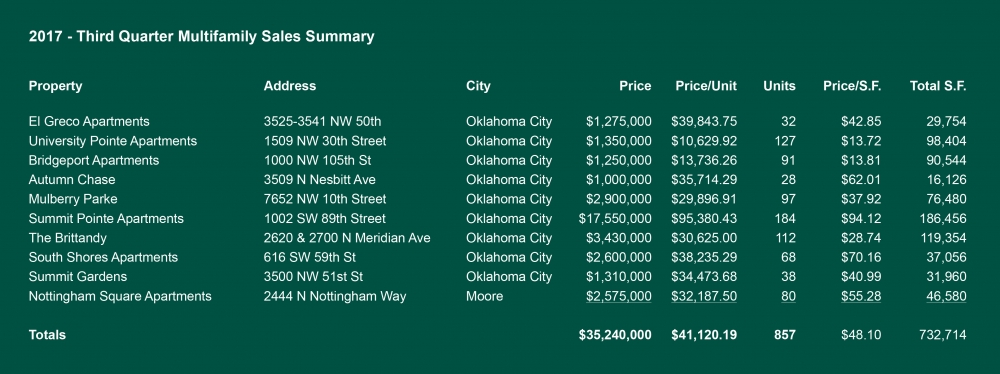
Multifamily Market Sees Over $35,000,000 in Third Quarter Sales
In the third quarter of 2017, the Oklahoma City multifamily market seemed to take a breather after having such a strong second quarter. While year-to-date numbers are still on track to provide yet another solid year, the third quarter was particularly weak in terms of transaction activity. Some now wonder, is this the beginning of the end or is this just the market getting its second wind. We are now 99 months into this expansion phase, which although longer than most we have experienced, it’s still 21 months behind the longest which was during the early/mid 2000’s. While the market still hasn’t been able to exceed the peak of 2007’s total units sold of 9,791, we have far exceeded the average price per unit during that pre-recession ramp up of $31,090. Interestingly, during the peak in 2007, Oklahoma City’s unemployment ranged from as low as 3.7% to as high as 4.4%. In 2017, unemployment has ranged from 3.8% to now 4.4%, strikingly similar. Hopefully this isn’t an indicator of things to come as the multifamily market in 2008 took a turn for the worse with transaction volume dropping year after year for the next three years. Although the employment rate is feeling pressure, one would consider 4.4% virtually full employment, so that alone is not cause for alarm. The current construction boom has begun to slow down as developers are realizing absorption is taking longer than anticipated, and as long as they continue to pump the breaks the units will eventually lease up. The low occupancy rate in select areas is not due to a lack of need, rather, it’s due to a surplus in inventory over a short period of time. We are not out of the woods yet as there is still a little over 2,700 units under construction with about the same in planning stages. Those in planning stages are likely to be delayed some, but those already under construction will put more units onto a saturated market causing slow lease-ups for the next 6-12 months. Prior to the construction boom, the average lease-up time was 4-8 months for a property in a decent location. Now, even in prime locations most are taking well over twelve months, some over twenty-four. This slow absorption will likely remain until the oil market provides more jobs or other industries start to add large scale jobs into the market; however, they will eventually lease these units and the properties will stabilize.
The second quarter saw 10 multifamily transactions involving twenty-five units or more, with a total of only 857 units trading hands. Although this volume is 74% below the previous quarter and 65% below the same quarter last year, this isn’t something to get alarmed about. During the current expansion phase, we have eight quarters that were below this number. Year to date, the total transaction volume is $225,712,411, almost exactly the same as the same time last year. This total year-to-date volume represents 5,466 units giving the market an average per unit price of $41,294, only 16% below the average price at the same point the previous year.
When you break the transactions down by class, the largest volume in terms of dollars for the quarter came in Class B. There was one transaction for $17.5 million breaking down to $95,380 per unit. Class C properties had a total volume of just over $16 million. These 546 units broke down to an average price per unit of $29,927, or $32,998 for performing properties. Class D had one transaction for $1.35 million for a vacant 127-unit property, trading for $10,630 per unit. One of the better indicators of the overall health of the Class C market is the year-to-date numbers. So far in 2017, Class C has had 4,431 units trade hands, a 25% increase from last year, trading for just under $170 million bringing the year-to-date price per unit to $38,132. This is 1.5% above the previous time last year.
As previously stated, new deliveries are slowing down as new properties are absorbing fewer units and offering more concessions. This trend has caused several developers to put projects on the back burner unless in strategic locations. We expect Class A to continue to feel the pressure over the next 6-12 months until the pipeline clears out a little more, while other asset times will maintain status quo. We don’t expect to see tremendous rent growth at the end of the year, but we do believe it will be positive. There has been more default activity and a few more receiverships and foreclosures hitting the market, although so far are caused by specific situations and not the overall economy. Lenders do appear to be a little pickier as rates creep up, and they are turning more away than they would have 12-24 months earlier. This is often the sign of the market slowing down, but other national indicators appear to indicate the opposite. Job growth nationally is fueling development, albeit not at the pace of 2016 and 2017. Hurricanes have slowed down one of the largest apartment markets, Houston, but will also be followed by another construction boom. For now, buyers are mostly still underwriting based on actual numbers with realistic projections, and until that trend changes as it did in the last boom, we should remain on solid ground. We’ve said it before, but we strongly encourage any apartment owners who have contemplated selling to look into the opportunity now, as this market may not last much longer.
David Dirkschneider
Multifamily Investment Specialist