Third Quarter Office Sales Exceed Previous Two Quarters
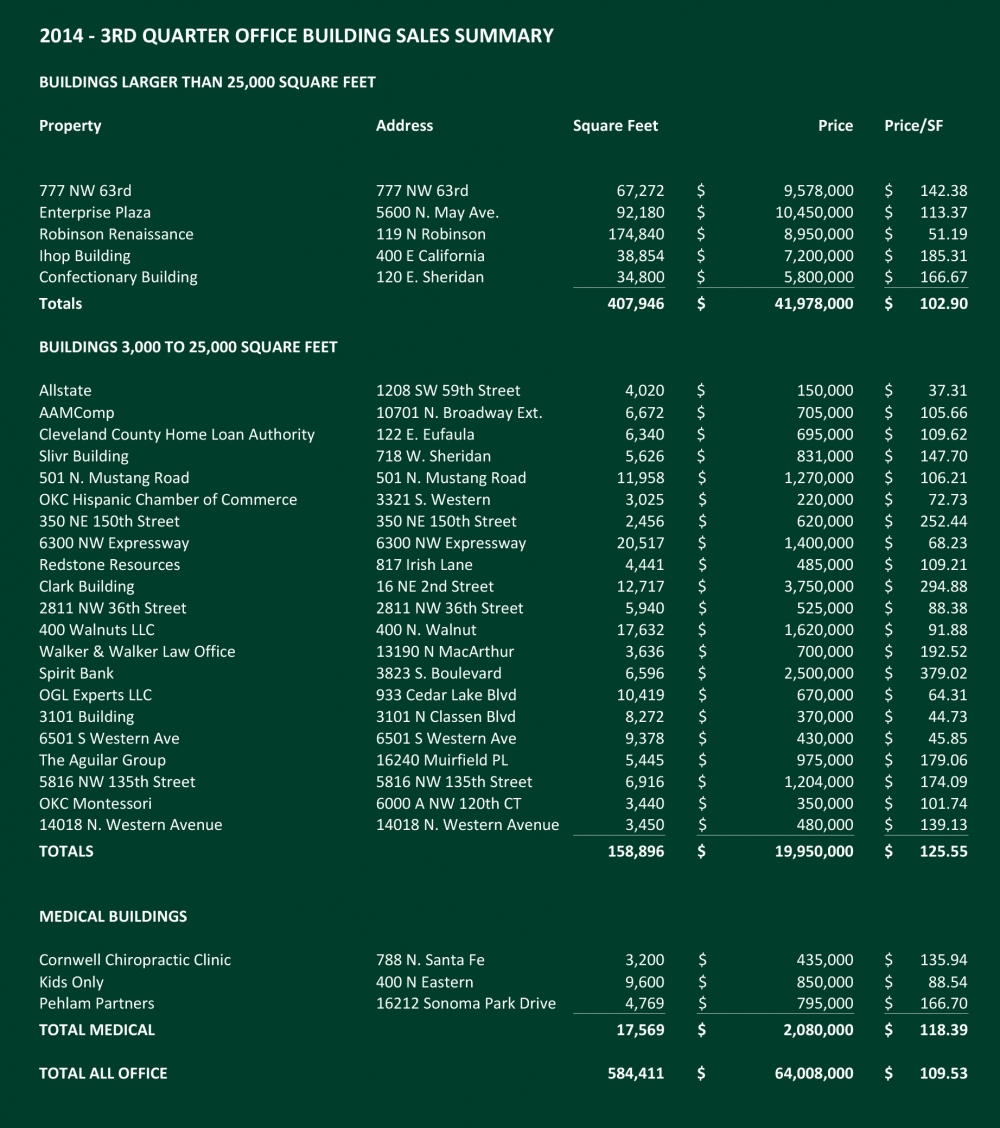
Office building sales in the third quarter of 2014 continue to reflect the strength of the Oklahoma City economy. This quarter saw the last of the large Chesapeake owned office properties, Regency Center, sell to a newly formed spin-off entity, Seventy Seven Land Company. In total, there were twenty-nine general office and medical office buildings transactions this quarter, encompassing just under 600,000 square feet of space. The quarter’s sales volume of $64,008,000 exceeded each of the previous two quarters.
Of the five large office building sales, those containing in excess of 25,000 square feet, two of the sales involved assets in Bricktown, which had per square foot pricing higher than those of either the one CBD sale (Robinson Renaissance) or the two suburban transactions (Enterprise Plaza and Regency Center). These two transactions speak very highly of the perceived financial upside in the Bricktown area as it continues to be transformed from largely an entertainment district to one where people also live and work.
Twenty-one smaller buildings, containing between 3,000 square feet and 25,000 square feet, sold for a total of $19,950,000 averaging $125.55 per square foot. Demand for smaller buildings remains very high, with a lack of quality inventory in this product category.
Finally, three small medical office buildings sold, each of which contained less than 10,000 square feet, at an average price of $118.39 per square foot.
When these small building sales are analyzed individually there are significant high/low differences in the per square foot pricing. This is largely attributable to the variables of location, age, and physical condition. For the larger office buildings, occupancy, operating cost, average rental rates and tenant credit can be added to the investment matrix.
Overall, Oklahoma City continues its impressive economic recovery. As one of only three cities in the United States with at least 3.5% economic growth over the last three years, both corporations and individuals are investing record amounts of capital into commercial real estate across the metroplex. While new developments in the downtown area receive much of the press, the reality is that development is proceeding in all quadrants. This is expected to continue as long as the commodity pricing of oil and natural gas remains high enough to justify both finding costs and the industry’s inherent risks. It is too early to tell whether the recent drop in oil is a temporary phenomenon, or indicative of longer-term demand/supply imbalances. But at this juncture, there is no indication of a slow- down in activity.

Retail Market Sees Strong Sale Prices in Third Quarter
Four properties totaling nearly 550,000 square feet sold in the third quarter for a total consideration of $68.7 million. Centennial Plaza & Bryant Square, the two large well-located centers, received significant interest and both sold at capitalization rates near 7 percent. Inland American, who already has a significant Oklahoma presence, purchased Bryant Square while Centennial Plaza is Retail Centers of America¹s entry into the Oklahoma City market. There appears to be significant demand for these larger class A properties anchored by national tenants which, along with historically low-interest rates, has driven down capitalization rates. These institutional investors have such low costs of funds and are under pressure to place money, generally making private investors non-competitive. The issue going forward will be an availability of similar properties. The prices for smaller properties, like Glen Eagles and University Plaza III, are also strong. The large middle piece of the market, class B & C centers that have less prominent tenant profiles and are generally older, is still not seeing much trading velocity. There are willing buyers in the market, but few sellers. We anticipate this changing slowly over time, particularly as capitalization rates compress. But, many of the existing owners of these properties are getting good returns and do not have attractive investment alternatives for the proceeds.

Third Quarter Sales Reach Over $66,000,000 in Industrial Market
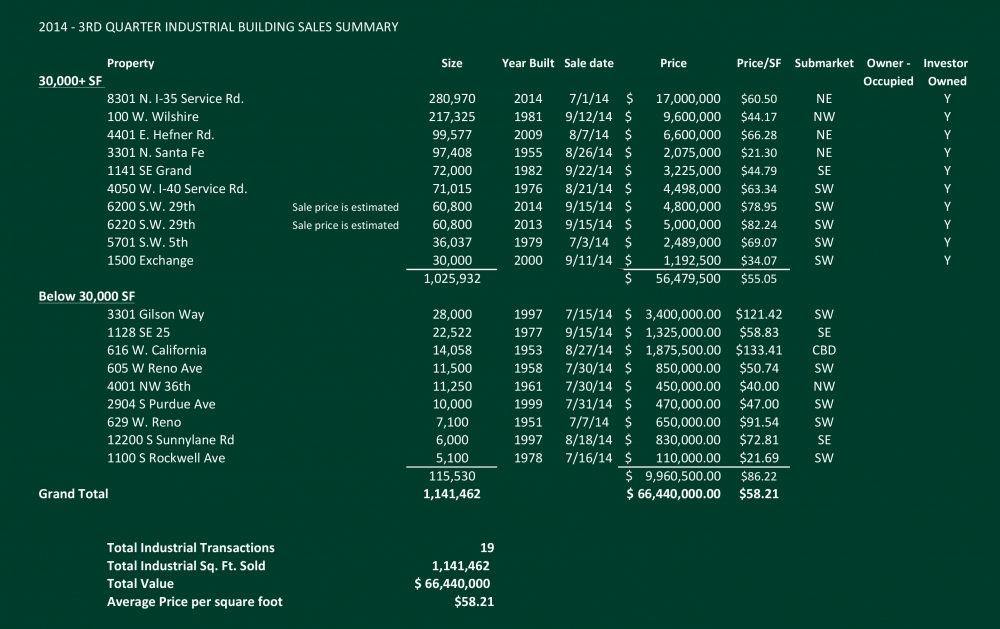
This was a remarkable quarter for investor-purchased properties in the Oklahoma City industrial market. There were a total of ten sales to investors of properties from 30,000 square feet to 280,970 square feet, totaling just over 1 million square feet of industrial space for a total consideration of $56.5 million. Of those ten sales, two were newly constructed facilities and two more had been built within the last five years. Two purchasers were out of state investors and the rest locally-based. Significantly, all of these sales were locally generated and did not involve portfolio transactions by out-of-state institutional owners. Looking at all industrial sales over 5,000 square feet, a total of nineteen sales represented 1.14 million square feet with an average size of 60,000 square feet and a total consideration of $66.4 million. The average per square foot price was $58.21. In contrast, the 3rd quarter of 2013 recorded 11 sales totaling 194,855 square feet for just over $5.6 million.
There is nothing to indicate that the current trend of low vacancies, and inflating sale and lease prices will end anytime soon. Once again, the primary limit to the market is the availability of quality space.

Multifamily Market Sales Reach $82,000,000 in Third Quarter
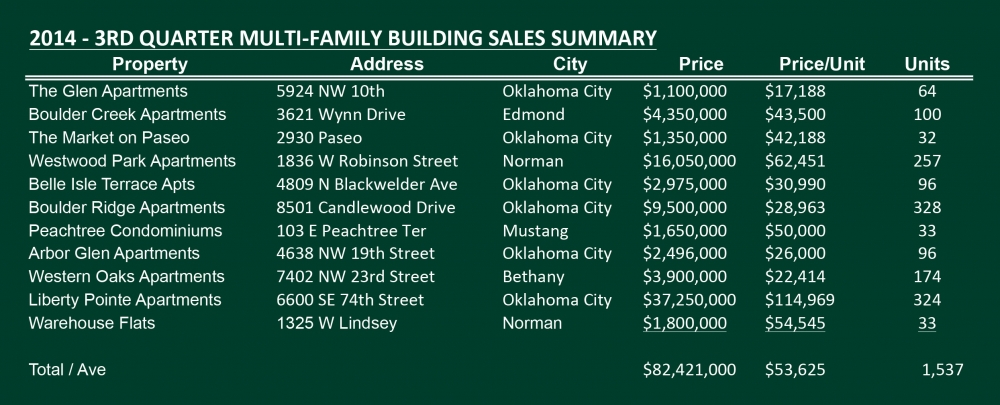
In the third quarter of 2014, the Oklahoma City multifamily market had a total of 11 transactions totaling 1,537 units for a sales volume of $82,421,000. This is an average price per unit of $53,625 for properties selling during the third quarter only. The third quarter had a significantly higher sales volume than the first quarter of 2014 increasing 305% as well, just slightly higher than the second quarter with just over a 5% increase. When combined with the first and second quarters, the total sales volume for 2014 has reached $182,655,000; which is still 33% lower for the same time period in 2013 where the total sales volume was just over $272 million. However, the total units sold compared to the same time period last year was only down 11% which indicates the quality of asset trading is lower than those trading in 2013. For example, in quarters 1-3 of 2013 just over $215 million in Class A properties were sold, compared to just over $37 million in 2014. This represents an 83% decrease in total volume of Class A properties and caused the total multifamily average price per unit to drop by 24%. This is not an indication of values declining; in fact, the opposite is actually true in the current market. Properties that are being fully marketed and that are provided access to as many buyers as possible are fetching prices that are reaching levels not seen since before the recession. The most notable value increase is with the C Class assets. Stabilized Class C assets are actually achieving prices not seen even prior to the recession, and through the third quarter have an average price per unit of $35,859. Class C distressed assets have an average of $17,508 at the end of the third quarter, which also has not been seen since prior to the recession.
In recent years Class A properties have received most of the spotlight, however, the majority of those assets with owners willing to sell have recently traded. The remaining properties are being held onto so Class A investors eagerly await the delivery of new construction to bid for their purchase. At the end of the third quarter, only one Class A property has traded achieving a price of $37,250,000 with 324 units, giving it a price per unit of $114,969. Because there was only one transaction, it’s difficult to conclude this is an “average” price for the Class A market, however, this is the only average price at this time. Due to the lack of Class A inventory, buyers are forced to look elsewhere and has caused the Class B market to heat up compared to historical standards. At the end of the third quarter, there were a total of eight Class B transactions with 2,040 units, achieving a price of $84,500,000. This gives the Class B assets an average price per unit of $41,422. However, it should be noted there was one large off-market portfolio sale that was sold for what appears to be a well below market price, therefore has caused the average for Class B assets to drop dramatically. When compared to the same time period last year, this is a 21% drop from the average price per unit of $52,381 which is a number that’s more closely in line with historical standards. If this portfolio were to be removed from the averages, then the adjusted average would be $51,779 and although is still slightly lower than that of 2013, it’s more realistically an average price that can be relied upon.
The most notable increase comes from the Class C market, where at the end of the third quarter of 2014 there were a total of 17 transactions and a total volume of $60,905,000, an increase of 35% compared to the volume from the same time period of 2013. There were 1,765 units trading and an average price per unit of $34,507. This average price is just over a 50% increase from the $22,961 achieved through the third quarter of 2013. We believe this shows a confidence shift in the Class C assets as distressed assets have mostly flushed through the system and 83% of the total Class C properties sold were stabilized as compared to 61% at the end of the third quarter in 2013. The demand for quality C Class assets will continue to increase as the lack of A and B Class units are available; in addition to the increased availability of financing and capital for these types of projects.
Going forward we expect the demand to remain strong, and transaction volumes to continue increasing. Although 2014 is down almost 33% in volume from the previous year, the total units are only down by 11%. We expect the total unit count for 2014 to easily surpass the total unit count of 2013; however, the total volume will likely lag behind due to the lack of Class A transactions. We believe there will be continued upward pressure on Class B and C prices for the same reason. Owners and managers continue to report occupancies are nearing all-time highs, therefore are instituting regular rent increases which are seeing very little if any resistance. New deliveries are continuing to move forward at slightly above historical averages, but are still not able to meet pent-up demand, therefore should have little to no impact on occupancies or rents. The majority of new deliveries are in areas with significant demand, and lack of housing supply so should have even less effect on existing supply. The key to achieving these record-setting prices is for sellers to be aware of the markets conditions, and to actively put properties on the open market whereby they can solicit bids from multiple buyers. The market economics have proven those assets sold in “off-market” type transactions are achieving inferior pricing compared to those professionally marketed to a broad scope of buyers and receiving multiple offers.


